The difference between the maximum and the minimum ratio of History to Geography is:
Directions (81–85): The questions are based on the graph given below. Answer the following questions.
निर्देश (81–85): नीचे दिए गए ग्राफ के आधार पर निम्नलिखित प्रश्नों के उत्तर दीजिए।
The graph shows the ratio of marks obtained in History to Geography by 7 students in an examination.
ग्राफ एक परीक्षा में 7 छात्रों द्वारा इतिहास तथा भूगोल में प्राप्त अंकों का अनुपात दर्शाता है।
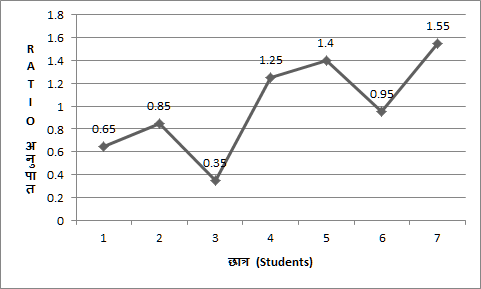
The difference between the maximum and the minimum ratio of History to Geography is:
इतिहास : भूगोल के अधिकतम तथा न्यूनतम अनुपात का अंतर कितना है?
Detailed Solution & Logic
1.20
Similar Practice Questions
What is the total number of employees working in the Accounts and Production
Study the pie chart and the table given below and answer the questions that follow.नीचे...
If the total contribution by FII is ₹ 33,000 crore, then the funds contributed towards the subscription of Bharat Bonds by NRIs and Banks are :
Directions : The following pie chart shows the subscription generated for Bharat Bonds. Study the...
Which article has the highest percentage loss?
The table given below shows the cost price and selling price of four articles ....
If the difference between funds contributed by the Public and Pension funds is ₹ 5,000 crore, then the total funds subscribed for Bharat Bonds are approximately :
Directions : The following pie chart shows the subscription generated for Bharat Bonds. Study the...
What is the percentage increase in the number of players from Game D to Game E in School M?
Study the given graph carefully and answer the question that follows. दिए गए ग्राफ का...
What is the increase in the number of books sold from January to June?
The following line graph shows the number of books sold by a bookstore during six...
In which school is the ratio of players in Game D to Game E the highest?
Study the given graph carefully and answer the question that follows. दिए गए ग्राफ का...