The following bar graph What is the ratio between the total sales of F1 and total sales of F4 in all the years?
The following bar graph shows the sales (in thousands) of motor bikes by factories F1, F2, F3 and F4 in the years 2017, 2018 and 2019.
निम्न दंड आलेख, वर्ष 2017, 2018 और 2019 में कारखाने F1, F2, F3 और F4 द्वारा की गई मोटर बाइकों की बिक्री (हजार में) को दर्शाता है|
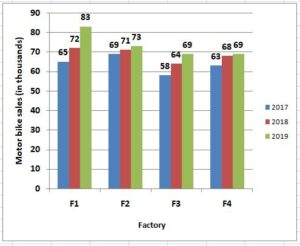
What is the ratio between the total sales of F1 and total sales of F4 in all the years?
सभी वर्षो में F1 द्वारा की गई कुल बिक्री और F4 द्वारा की गई कुल बिक्री के बीच क्या अनुपात है?
Detailed Solution & Logic
Correct Answer:
11 : 10
Similar Practice Questions
If sin A = 0.6, What is the value of tan A?
If sin A = 0.6, What is the value of tanA? यदि sin A =...
A man has invested ₹50,500 at a rate of 6% per annum simple interest for 2 years. Find the amount (in ₹) that he will receive after 2 years.
A man has invested ₹50,500 at a rate of 6% per annum simple interest for...
In a park there are rabbits and pigeons in the ratio 4 : 9.
In a park there are rabbits and pigeons in the ratio 4 : 9. If...
If n is a natural number , then n(n +1) (n +2) (n +3) +1 is always:
If n is a natural number , then n(n +1) (n +2) (n +3) +1...
A’s salary is 40% more than B’s. If B’s salary increases by 20% and A’s increases by x%, then A’s new salary becomes 25% more than B ‘s new salary. What is the value of x?
A’s salary is 40% more than B’s. If B’s salary increases by 20% and A’s...
In a test, B got 50 marks while A got 75 marks, out of 95 maximum marks. What percentage of A’s marks was B’s marks?
In a test, B got 50 marks while A got 75 marks, out of 95...
The average speed of a train is \(\frac{13}{3}\) times the average speed of a tractor. Tractor 270 km in 15 hours. Decides. What distance will it cover in 12 hours?
The average speed of a train is \(\frac{13}{3}\) times the average speed of a tractor....