The pie – chart shows the number of students (boys and girls)
Study the given pie chart and answer the following question.
The pie – chart shows the number of students (boys and girls) studying in class 10 of different schools (X, Y, Z) in the year 2022.
दिए गए पाई – चार्ट का अध्ययन कीजिए और निम्नलिखित प्रश्न का उत्तर दीजिए।
पाई – चार्ट, वर्ष 2022 में विभिन्न स्कूलों (X, Y, Z) के कक्षा 10 में पढ़ने वाले छात्रों (लड़के और लड़कियों) की संख्या को दर्शाता है।
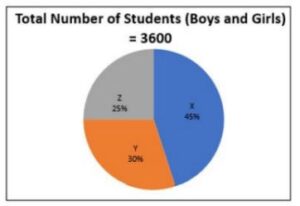
Total Number of Student ( Boys and Girls ) = 3600,छात्रों की कुल संख्या (लड़के और लड़कियां) =3600
What is the difference between the total number of students (boys and girls) in schools Y and Z together and the total number of students (boys and girls) in schools X and Y together?
स्कूल Y और Z में एक साथ मिलाकर छात्रों (लड़को और लड़कियों) की कुल संख्या और स्कूल X और Y में एक साथ मिलाकर छात्रों (लड़को और लड़कियों) की कुल संख्या के बीच कितना अंतर है?