What is the increase in the number of books sold from January to June?
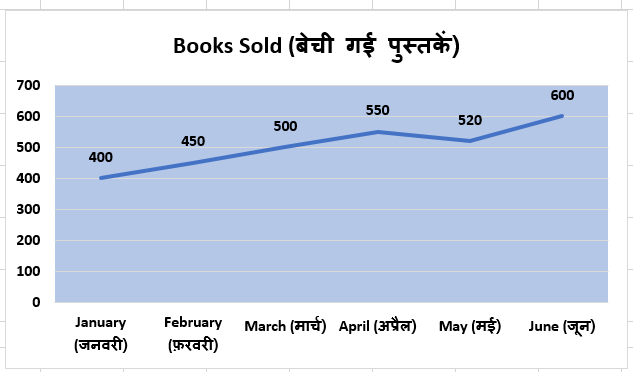
The following line graph shows the number of books sold by a bookstore during six months.
नीचे दिया गया रेखा ग्राफ छह महीनों में एक पुस्तक भंडार द्वारा बेची गई पुस्तकों की संख्या दर्शाता है।
What is the increase in the number of books sold from January to June?
जनवरी से जून तक बेची गई पुस्तकों की संख्या में कितनी वृद्धि हुई?
Detailed Solution & Logic
Correct Answer:
200
Solution
January = 400
June = 600
Increase = 600 − 400 = 200
Similar Practice Questions
In which month were the maximum books sold?
The following line graph shows the number of books sold by a bookstore during six...
Which company sales highest number of bike ?
The bar graph shows the sales of bike and cars of five companies J, K,...
What percentage of loss incurred in the selling of article D ?
The table given below shows the cost price and selling price of four articles ....
In which year was the production of scooters of all factories equal to the yearly average number of scooters produced during 1985–89?
Study the table carefully and answer the questions given below. Yearly production (In thousands) of...
The number of accounts opened in August is approximately what percent more or less
Directions (96–100): Study the table given below and answer the following questions. निर्देश (96–100): नीचे...
The total cost price of D, E and F is what percent of the total selling price of E, F and G ?
The table given below shows the cost price and selling price of four articles ....
What is the ratio of the number of students who passed in 2021 to those who passed in 2025?
Study the table and answer the following questions. तालिका का अध्ययन करके निम्नलिखित प्रश्नों के...