What was the ratio of the trade loss in the year 2015 to that in the year 2018?
Read the following graph and answer the questions that follow.
निम्नलिखित ग्राफ को पढ़िए और प्रश्नों के उत्तर दीजिए
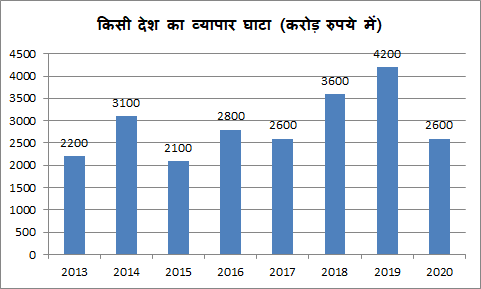
What was the ratio of the trade loss in the year 2015 to that in the year 2018?
वर्ष 2015 तथा वर्ष 2018 में व्यापार घाटे का अनुपात कितना था?
Detailed Solution & Logic
Correct Answer:
7:12
2100:3600 = 7:12
Similar Practice Questions
Student 4 got 60 marks in Geography. His marks in History are:
Directions (81–85): The questions are based on the graph given below. Answer the following questions....
Which company has the highest difference between bike and truck production?
The table given below shows the production of bike and truck by five companies नीचे...
How many books were sold in March and April together?
The following line graph shows the number of books sold by a bookstore during six...
In which year was the total production of scooters of all factories 20% of the total production during 1985–1989?
Study the table carefully and answer the questions given below. Yearly production (In thousands) of scooters...
By what percentage was the sales in 2025 higher than that in 2021?
Study the following graph and answer the questions. निम्नलिखित ग्राफ का अध्ययन करके प्रश्नों के...
What is the total number of selected candidates from Lucknow and Prayagraj?
The following bar graph shows the number of candidates selected from five districts in a...
What is the ratio of the combined number of graduates in towns A and B to the combined number of postgraduates in towns A and E ?
Direction: The table given below show the data of graduates and postgraduates residing in various...