The following line graph shows the number of books sold by a bookstore during six months.
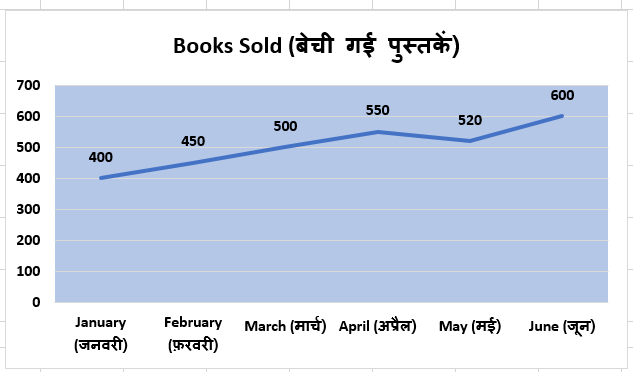
The following line graph shows the number of books sold by a bookstore during six months.
नीचे दिया गया रेखा ग्राफ छह महीनों में एक पुस्तक भंडार द्वारा बेची गई पुस्तकों की संख्या दर्शाता है।
During which month did the sales decrease compared to the previous month?
पिछले महीने की तुलना में किस महीने बिक्री में कमी आई?
Detailed Solution & Logic
Correct Answer:
May / मई
Solution / समाधान:
April = 550 books
May = 520 books
Since 520 < 550, sales decreased in May.
अप्रैल में 550 तथा मई में 520 पुस्तकें बिकीं।
अतः बिक्री मई में घटी।
Answer = May / मई ✅
Similar Practice Questions
The ratio of gross profit to net profit in a year was greatest in the year.
Study the given graph carefully and answer the questions that follow. दिए गए ग्राफ का ध्यानपूर्वक...
What is the ratio of the number of students who passed in 2021 to those who passed in 2025?
Study the table and answer the following questions. तालिका का अध्ययन करके निम्नलिखित प्रश्नों के...
What is the ratio of the combined number of graduates in towns A and B to the combined number of postgraduates in towns A and E ?
Direction: The table given below show the data of graduates and postgraduates residing in various...
If the total contribution by FII is ₹ 33,000 crore, then the funds contributed towards the subscription of Bharat Bonds by NRIs and Banks are :
Directions : The following pie chart shows the subscription generated for Bharat Bonds. Study the...
How many more students passed in 2022 and 2024 together than in 2021 and 2023 together?
Study the table and answer the following questions. तालिका का अध्ययन करके निम्नलिखित प्रश्नों के...
By what percentage was the sales in 2025 higher than that in 2021?
Study the following graph and answer the questions. निम्नलिखित ग्राफ का अध्ययन करके प्रश्नों के...
What percentage of the total number of players in Game D are participating from School R?
Study the given graph carefully and answer the question that follows. दिए गए ग्राफ का...