Study the following graph and answer the questions.
Study the following graph and answer the questions.
निम्नलिखित ग्राफ का अध्ययन करके प्रश्नों के उत्तर दीजिए।
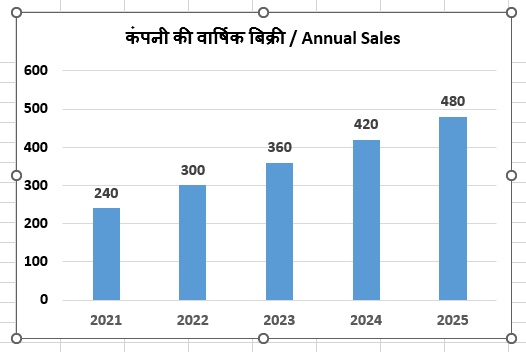
What was the total sales over all five years?
पाँचों वर्षों की कुल बिक्री कितनी थी?
Detailed Solution & Logic
Correct Answer:
₹1,800 करोड़ / ₹1,800 crore
Solution: 240+300+360+420+480=1800 करोड़।
Similar Practice Questions
The average production during the eight years was:
Directions (86–90): Study the graph given below and answer the following questions. निर्देश (86–90): नीचे...
Study the given bar graph What was the percentage of students who passed in second division in the year 2010?
Study the given bar graph and answer the following question. दिए गए दंड आरेख का...
In which year did the commission earned by Salesman C show the highest increase
Directions (91–95): Read the following table and answer the questions given below it. निर्देश (91–95):...
The number of graduates in town F is what percentage higher than the number of postgraduates in the same town ?
Direction: The table given below show the data of graduates and postgraduates residing in various...
What is the average number of male candidates across all five districts?
Study the table and answer the following questions. तालिका का अध्ययन करके निम्नलिखित प्रश्नों के...
The difference between the average gross profit and the average net profit calculated for four years is:
Study the given graph carefully and answer the questions that follow. दिए गए ग्राफ का ध्यानपूर्वक...
Which article has the smallest loss amount?
The table given below shows the cost price and selling price of four articles. नीचे...