Study the given bar graph What was the percentage of students who passed in second division in the year 2010?
Study the given bar graph and answer the following question.
दिए गए दंड आरेख का अध्ययन करें और निम्नलिखित प्रश्न का उत्तर दें।
The bar graph given below shows the higher secondary students of a school for the years 2008, 2009 and 2010.
नीचे दिए गए दंड आरेख में एक स्कूल के वर्ष 2008, 2009 और 2010 के उच्च माध्यामिक – विद्यार्थियों को दिखाया गया है।
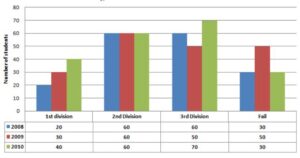
What was the percentage of students who passed in second division in the year 2010?
वर्ष 2010 में द्वितीय श्रेणी में उत्तीर्ण होने वाले विद्यार्थियों का प्रतिशत कितना था?
Detailed Solution & Logic
Correct Answer:
30%
Solution:
In 2010:
- Students in 2nd Division = 60
- Total students = 40 + 60 + 70 + 30 = 200
Percentage:
$\frac{60}{200}\times100 = 30%$
Answer: 30%
Similar Practice Questions
In the year 2020, for which crop was the increase in production over the previous year the highest?
Year / वर्ष Wheat / गेहूँ Rice / चावल Barley / जौ Other Grains /...
What percentage of the total number of players in Game D are participating from School R?
Study the given graph carefully and answer the question that follows. दिए गए ग्राफ का...
By what percentage were the maximum marks in Mathematics higher than the maximum
Year / वर्ष English (Maximum) / अंग्रेजी (अधिकतम) English (Average) / अंग्रेजी (औसत) Mathematics (Maximum)...
The following line graph shows the number of books sold by a bookstore during six months.
The following line graph shows the number of books sold by a bookstore during six...
By what percentage is the number of male candidates in District C more than that in District B?
Study the table and answer the following questions. तालिका का अध्ययन करके निम्नलिखित प्रश्नों के...
The average production during the eight years was:
Directions (86–90): Study the graph given below and answer the following questions. निर्देश (86–90): नीचे...
What is the total number of children in Areas P and Q together?
Q: The following table represents the population of four different areas and the percentage of...