The average production during the eight years was:
Directions (86–90): Study the graph given below and answer the following questions.
निर्देश (86–90): नीचे दिए गए ग्राफ का अध्ययन कीजिए और निम्नलिखित प्रश्नों के उत्तर दीजिए।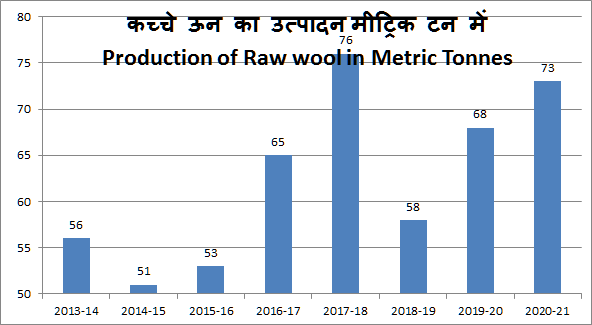
The average production during the eight years was:
आठ वर्षों के दौरान औसत उत्पादन कितना था?
Detailed Solution & Logic
Correct Answer:
62.5 MT / 62.5 मिलियन टन
Similar Practice Questions
What is the ratio of the combined number of graduates in towns A and B to the combined number of postgraduates in towns A and E ?
Direction: The table given below show the data of graduates and postgraduates residing in various...
How many students got more marks in History than in Geography?
Directions (81–85): The questions are based on the graph given below. Answer the following questions....
Direction: The table given below show the data towns A, C, E and F together ?
Direction: The table given below show the data of graduates and postgraduates residing in various...
What is the difference between the total number of graduates and postgraduates across all the towns ?
Direction: The table given below show the data of graduates and postgraduates residing in various...
What is the total wheat production of all villages in 2023?
The following table shows the production of wheat (in tonnes) by five villages. निम्नलिखित तालिका...
How many more students passed in 2022 and 2024 together than in 2021 and 2023 together?
Study the table and answer the following questions. तालिका का अध्ययन करके निम्नलिखित प्रश्नों के...
Details of the percentage of employees working in different departments of an
Study the pie chart and the table given below and answer the questions that follow.नीचे...