The production of raw wool in 2014–15 was __________ of the production in 2019–20.
Directions (86–90): Study the graph given below and answer the following questions.
निर्देश (86–90): नीचे दिए गए ग्राफ का अध्ययन कीजिए और निम्नलिखित प्रश्नों के उत्तर दीजिए।
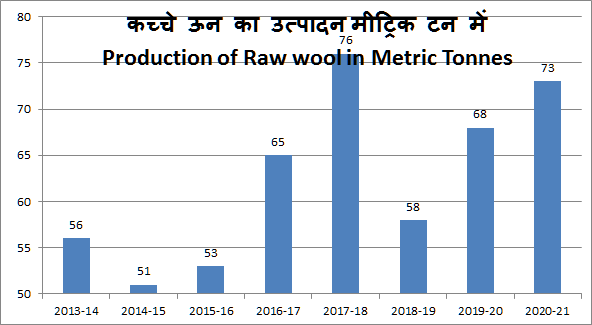
The production of raw wool in 2014–15 was __________ of the production in 2019–20.
वर्ष 2014–15 में कच्चे ऊन का उत्पादन, वर्ष 2019–20 के उत्पादन का __________ था।
Detailed Solution & Logic
Correct Answer:
$ \frac 34$
Similar Practice Questions
What was the average sales in 2022 and 2024?
Study the following graph and answer the questions. निम्नलिखित ग्राफ का अध्ययन करके प्रश्नों के...
The production of company A is approximately what per cent of the demand
The graph shows the demand and production of different companies. Study the graph and answer...
The ratio of the production of scooters by factory P to that by factory T in 1985 is:
Study the table carefully and answer the questions given below. Yearly production (In thousands) of scooters...
For the entire four years as shown, the ratio of total gross profit to total net profit is:
Study the given graph carefully and answer the questions that follow. दिए गए ग्राफ का ध्यानपूर्वक...
How many books were sold in March and April together?
The following line graph shows the number of books sold by a bookstore during six...
On which day was the maximum total number of mobile phones sold?
The following table shows the number of mobile phones sold by a shop during five...
What is the percentage increase in the number of players from Game D to Game E in School M?
Study the given graph carefully and answer the question that follows. दिए गए ग्राफ का...