During the last four years, the production of raw wool increased by ____ % compared
Directions (86–90): Study the graph given below and answer the following questions.
निर्देश (86–90): नीचे दिए गए ग्राफ का अध्ययन कीजिए और निम्नलिखित प्रश्नों के उत्तर दीजिए।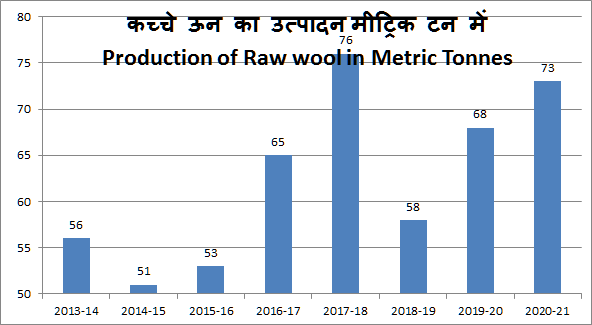
During the last four years, the production of raw wool increased by ____ % compared to the production
of the first four years.
अंतिम चार वर्षों के दौरान, कच्चे ऊन का उत्पादन पहले चार वर्षों के उत्पादन की तुलना में ____ % बढ़ा।
Detailed Solution & Logic
Correct Answer:
22.2
Similar Practice Questions
How many more female candidates are there in Districts B and C together than in Districts A and D together?
Study the table and answer the following questions. तालिका का अध्ययन करके निम्नलिखित प्रश्नों के...
If the bike production of Company C were to increase by 25%, what would be the new
The table given below shows the production of bike and truck by five companies. नीचे...
Study the following graph and answer the questions.
Study the following graph and answer the questions. निम्नलिखित ग्राफ का अध्ययन करके प्रश्नों के...
The production of company A is approximately what per cent of the demand
The graph shows the demand and production of different companies. Study the graph and answer...
In the year 2019, the commission earned by Salesman D was approximately what percent
Directions (91–95): Read the following table and answer the questions given below it. निर्देश (91–95):...
What is the average production of company C, D, and E ?
The graph shows the demand and production of different companies. Study the graph and answer...
In which area is the number of males equal to the number of children?
Q: The following table represents the population of four different areas and the percentage of...