What is the average production of company C, D, and E ?
The graph shows the demand and production of different companies. Study the graph and answer the questions.
ग्राफ विभिन्न कंपनियों की मांग (Demand) और उत्पादन (Production) को दर्शाता है। ग्राफ का अध्ययन कीजिए और दिए गए प्रश्नों के उत्तर दीजिए।
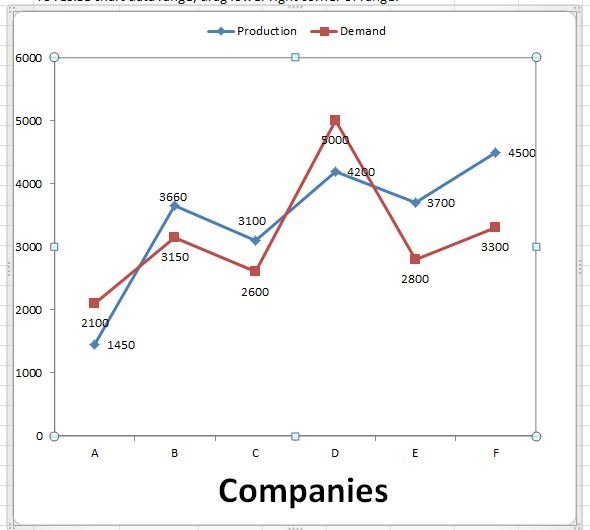
What is the average production of company C, D, and E ?
कंपनी C, D और E का औसत उत्पादन कितना है?
Detailed Solution & Logic
Correct Answer:
3666.68
Company = 3100+ 4200+3700
=$ \frac{11000}{3}$ = 3666.68
Similar Practice Questions
Q.What is the total number of mobile phones sold during all five days?
The following table shows the number of mobile phones sold by a shop during five...
The production of raw wool in 2014–15 was __________ of the production in 2019–20.
Directions (86–90): Study the graph given below and answer the following questions. निर्देश (86–90): नीचे...
What is the average production of bikes (J1) by all the 5 companies?
The table given below shows the production of bike and truck by five companies. नीचे...
Which salesman’s commission in 2018 showed the highest increase over that in 2015?
Directions (91–95): Read the following table and answer the questions given below it. निर्देश (91–95):...
How many books were sold in March and April together?
The following line graph shows the number of books sold by a bookstore during six...
What was the ratio of the trade loss in the year 2015 to that in the year 2018?
Read the following graph and answer the questions that follow. निम्नलिखित ग्राफ को पढ़िए और...
What is the average number of male candidates across all five districts?
Study the table and answer the following questions. तालिका का अध्ययन करके निम्नलिखित प्रश्नों के...