What is the value of (p2-p1) ?
The bar graph shows the sales of bike and cars of five companies J, K, L, M, and N.
बार ग्राफ पाँच कंपनियों J, K, L, M और N द्वारा बेची गई बाइकों तथा कारों की संख्या को दर्शाता है।
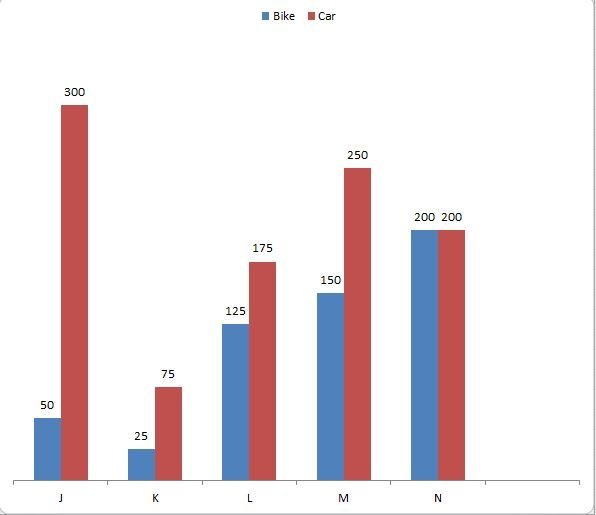
P1 = The total sales of bikes of all the 5 companies. / पाँचों कंपनियों द्वारा बेची गई बाइकों की कुल बिक्री।
P2 = The total sales of cars of all the 5 companies./ पाँचों कंपनियों द्वारा बेची गई कारों की कुल बिक्री।
Q. What is the value of (p2-p1) ?
(P2 – P1) का मान क्या है?
Detailed Solution & Logic
Correct Answer:
450
Similar Practice Questions
If the difference between funds contributed by the Public and Pension funds is ₹ 5,000 crore, then the total funds subscribed for Bharat Bonds are approximately :
Directions : The following pie chart shows the subscription generated for Bharat Bonds. Study the...
How much wheat was produced by Village A in 2022 and 2023 together?
The following table shows the production of wheat (in tonnes) by five villages. निम्नलिखित तालिका...
In the year 2020, for which crop was the increase in production over the previous year the highest?
Year / वर्ष Wheat / गेहूँ Rice / चावल Barley / जौ Other Grains /...
What percentage of the students who appeared for the examination in 2024 passed?
Study the table and answer the following questions. तालिका का अध्ययन करके निम्नलिखित प्रश्नों के...
If the total investment is ₹ 55,000 crore, then the combined investment by Pension funds and the Public is :
Directions : The following pie chart shows the subscription generated for Bharat Bonds. Study the...
Student 4 got 60 marks in Geography. His marks in History are:
Directions (81–85): The questions are based on the graph given below. Answer the following questions....
In which year was the production of scooters of all factories equal to the yearly average number of scooters produced during 1985–89?
Study the table carefully and answer the questions given below. Yearly production (In thousands) of...