Which village showed a decrease in production from 2022 to 2023?
The following table shows the production of wheat (in tonnes) by five villages.
निम्नलिखित तालिका पाँच गाँवों में गेहूँ के उत्पादन (टन में) को दर्शाती है।
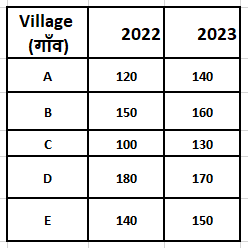
Q. Which village showed a decrease in production from 2022 to 2023?
किस गाँव में 2022 की तुलना में 2023 में उत्पादन कम हुआ?
Detailed Solution & Logic
Correct Answer:
D
Solution / समाधान
Village D:
2022 = 180
2023 = 170
Decrease = 10 tonnes
केवल गाँव D में उत्पादन कम हुआ।
Answer = D
Similar Practice Questions
What is the percentage increase in the number of players from Game D to Game E in School M?
Study the given graph carefully and answer the question that follows. दिए गए ग्राफ का...
Q.What is the total number of mobile phones sold during all five days?
The following table shows the number of mobile phones sold by a shop during five...
Details of the percentage of employees working in different departments of an
Study the pie chart and the table given below and answer the questions that follow.नीचे...
If the total population of Areas P and R combined is 26,000, what is the total number of children in these two areas?
Q: The following table represents the population of four different areas and the percentage of...
Which district has the highest number of selected candidates?
The following bar graph shows the number of candidates selected from five districts in a...
What is the increase in the number of books sold from January to June?
The following line graph shows the number of books sold by a bookstore during six...
How many books were sold in March and April together?
The following line graph shows the number of books sold by a bookstore during six...