Bar diagram and Pie chart previous year exam solved questions PDF for SSC CGL competitive exams for free download. Quantitative Aptitude (Maths) Statistics and Data Interpretation MCQs are very useful for students preparing for SSC CGL, CHSL, CPO, UPSSSC PET, Bank, RRB and any other examination. Fully solved questions with options and correct answers and explanation.
The previous year exam MCQ questions from the previous year exam of SSC CGL, CHSL, CPO, and SSC GD. UPSSSC PET and others recruitment agencies are including questions from this topic to assess the candidate capability to understand the Bar Diagram and Pie chart. This topic is also called Statistics and Data Interpretation.
Pie Diagram question
We are reproduce below, one question from the book PDF. Download Bar Diagram and Pie Chart question PDF for preparation of upcoming competitive exams.
The pie chart gives the expenditure (in percentage) on various items and savings of a family during a month. The monthly savings of the family is Rs 3000.
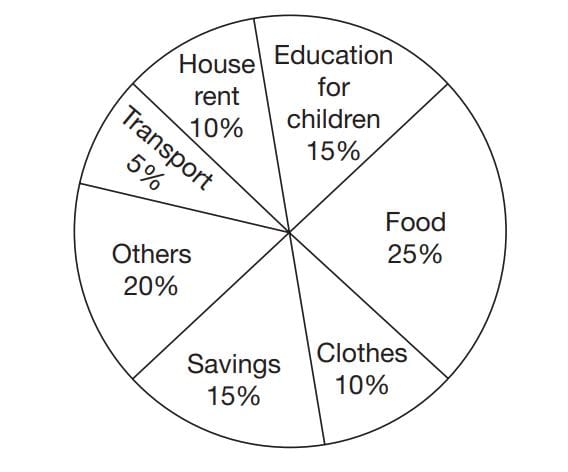
Question : On which item is the expenditure maximum and how much is it?
Options :
(a) Others, 2000 (b) Food,3000
(c) Others, 5000 (d) Food,5000
Answer : Food Rs 5000
Explanation: Expenditure of food = 25%
Savings = 15%
∴ 15% ≡ Rs 3000
25% = 3000/15 x 25 = 5000
Download : Bar Diagram and Pie chart Questions PDF
Document Name : Bar Diagram and Pie chart Questions
SSC CGL Previous year Solved Questions.
Topic : Statistics and Data Interpretation
Subject : Mathematics
Medium : English
Number of pages : 85
Free download Bar Diagram and Pie chart Questions from the below link :