Calculate the average number of players in Game E across all schools.
Study the given graph carefully and answer the question that follows.
दिए गए ग्राफ का ध्यानपूर्वक अध्ययन कीजिए और उसके आधार पर निम्नलिखित प्रश्न का उत्तर दीजिए।
The bar graph shows the number of players participating in two games in six different schools L, M, N, P, Q, and R.
यह बार ग्राफ छह विभिन्न विद्यालयों L, M, N, P, Q और R में दो खेलों में भाग लेने वाले खिलाड़ियों की संख्या को दर्शाता है।
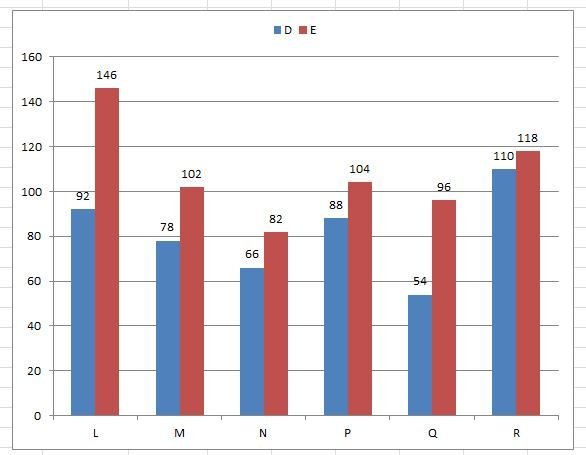
Q: Calculate the average number of players in Game E across all schools.
सभी विद्यालयों में खेल E के खिलाड़ियों की औसत संख्या ज्ञात कीजिए।
Detailed Solution & Logic
Correct Answer:
108
Answer: B) 108
Total number of players in game E:
146+102+82+104+96+118=646.
Average is :

Similar Practice Questions
What is the percentage increase in the number of players from Game D to Game E in School M?
Study the given graph carefully and answer the question that follows. दिए गए ग्राफ का...
The maximum rise in the production of raw wool was in which year?
Directions (86–90): Study the graph given below and answer the following questions. निर्देश (86–90): नीचे...
How many books were sold in March and April together?
The following line graph shows the number of books sold by a bookstore during six...
What was the percentage increase in the production of barley in 2019 compared
Year / वर्ष Wheat / गेहूँ Rice / चावल Barley / जौ Other Grains /...
Study the given bar graph What was the percentage of students who passed in second division in the year 2010?
Study the given bar graph and answer the following question. दिए गए दंड आरेख का...
Study the following graph and answer the questions.
Study the following graph and answer the questions. निम्नलिखित ग्राफ का अध्ययन करके प्रश्नों के...
What was the percentage increase in the loss in 2019 compared to the loss in 2015?
Read the following graph and answer the questions that follow. निम्नलिखित ग्राफ को पढ़िए और...