In which school is the ratio of players in Game D to Game E the highest?
Study the given graph carefully and answer the question that follows.
दिए गए ग्राफ का ध्यानपूर्वक अध्ययन कीजिए और उसके आधार पर निम्नलिखित प्रश्न का उत्तर दीजिए।
The bar graph shows the number of players participating in two games in six different schools L, M, N, P, Q, and R.
यह बार ग्राफ छह विभिन्न विद्यालयों L, M, N, P, Q और R में दो खेलों में भाग लेने वाले खिलाड़ियों की संख्या को दर्शाता है।
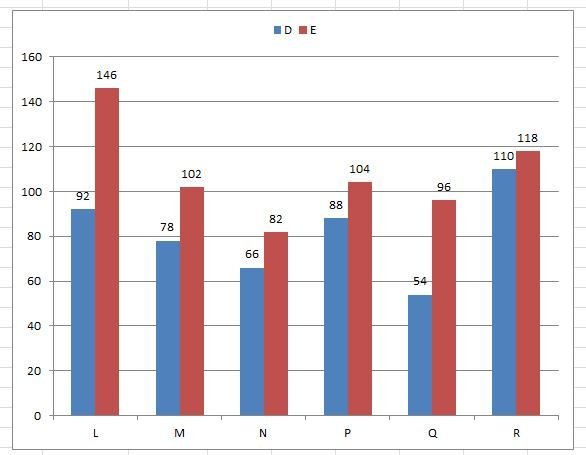
Q: In which school is the ratio of players in Game D to Game E the highest?
किस विद्यालय में खेल D और खेल E के खिलाड़ियों का अनुपात सबसे अधिक है?
Detailed Solution & Logic
Correct Answer:
P
Calculate the ratios:
L = $ \frac {92}{146} = 0.63$
M=$ \frac{78}{102}=0.63 $
P = \(\frac {88}{104} = 0.85 \)
Q=$\frac{54}{96}=0.56$
P ratio is 0.85, which is highest.
Similar Practice Questions
The number of graduates in town F is what percentage higher than the number of postgraduates in the same town ?
Direction: The table given below show the data of graduates and postgraduates residing in various...
The following line graph shows the number of books sold by a bookstore during six months.
The following line graph shows the number of books sold by a bookstore during six...
How much wheat was produced by Village A in 2022 and 2023 together?
The following table shows the production of wheat (in tonnes) by five villages. निम्नलिखित तालिका...
The selected candidates from Prayagraj are what percentage of those from Varanasi?
The following bar graph shows the number of candidates selected from five districts in a...
What was the percentage increase in the production of barley in 2019 compared
Year / वर्ष Wheat / गेहूँ Rice / चावल Barley / जौ Other Grains /...
What is the value of (p2-p1) ?
The bar graph shows the sales of bike and cars of five companies J, K,...
On which day was the maximum total number of mobile phones sold?
The following table shows the number of mobile phones sold by a shop during five...