Data Interpretation questions with answer and solution, based on given Table, Tabular MCQs for SSC CGL, CHSL, UPSSSC PET competitive exams. Mock test of previous year exam Quantitative Aptitude (Mathematics) objective questions for free online practice.
Quiz : Questions based on given table
Subject : Mathematics
Medium : English
Practice set of previous year SSC Questions
Immediate display of correct answer
Results

#1. Study the given table and answer the question that follows.
The table shows the classification of 100 student based on the marks obtained by them in Statistics and Mathematics in an examination out of 50. If at least 60 % marks in Mathematics are required for pursuing higher studies in Mathematics, then how many Students will be eligible to pursue higher studies in Mathematics ?
60% of 50 marks is 30.
Student with 30 and above in Mathematics =33
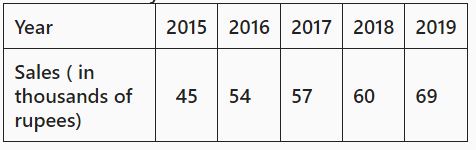
#2. The above table gives the sales of an electronic chip over 5 years. Finds the year in which the sales are equal to the average of the sales over the 5 years.
Average sales = 285/5=57
Equal to sales in 2027

#3. The table given shows the number of pens sold by two shopkeepers P and Q in 5 months.
J1 = The value of average number of pens sold by P in all five months.
J2 = The value of average number of pens sold by Q in all five months What is the value of (J1/J2)?
J1 =260/5
J2 =260/5
J1/J2 = 1

#4. The table given shows the production of bike and truck by five companies. A1 = The difference between the total production of bikes and trucks by all the 5 companies.
A2 = The average production of bike by company D, F and H.
what is the value of (A2/A1) ?
A1 =2250 -2200 =50
A2 = Average of 700,500,300 =1500/3=500
A2/A1 =500/50=10

#5. The table given shows production of car by two companies J and K in 5 years. L1 = the total production of car by J in all years. L2 = The total production of car by K in all years. what is the value of (L2 -L1) ?
L1=290
L2=400
L2-L1=110

#6. The table given shows the salary of 6 employees of a company. What is the total salary of all the employees ?
Sum of Salary = 2200

#7. The Table given shows the income and expenditure of a company in five years. saving = Income – Expenditure
What is the average saving in all years ?
Saving
A = 200
B= 150
C= 50
D= 300
E=75
Total saving =775
Average =775/5=155

#8. The table given shows production of taxi by two companies J and K in 5 years. Which of the following statement is not correct ?
I. the difference between the total production of taxi by J and K in all years is 35
II. The production of taxi by J in year P and Q together is 92.11 percent of the production of taxi by K in years R and S together.
Difference in production =350-295=55 (Statement 1 35 – not correct)
Taxi production by J in P and Q years =160
Taxi production by K in R and S years =170
(160/170) x100 =94.11 (Statement II -92.11% is not correct)

#9. The table given shows the cost price and value of profit of 6 articles. J1 = The value of average cost price of A, B, C and D.
J2 = The total profit of all articles.
What is the Value of (J1 : J2) ?
J1 =Average of 300,250,150,200 =900/4=225
J2= Total Profit =525
J1:J2 =225:525 =3:7 (divide by 75)

#10. The table given shows the production of refrigerator by 6 companies. What is the average production of refrigerator by all six companies ?
Average =Sum/6=680/6=113.33

#11. The table given shows the production of bike and truck by five companies.
J1 = The average production of bike by all the 5 companies.
J2 = The average production of truck by all the 5 companies.
What is the Value of (J1 : J2) ?
Average Bike =850/5=170
Average Truck=875/5=175
J1:J2 =170:175=34:35

#12. The table given shows the cost price and selling price of four articles. The total cost price of D, E and F is what percent of the total selling price of E, F and G ?
Cost Price DEF=1950
Selling price EFG=1800
(1950/1800)x100=108.33%

#13. The table given shows the cost price and selling price of four articles. What is the average value of loss of all articles ?
Total cost Price =1550
Total Selling Price =1225
Loss =1550-1225=325
Average loss =325/4=81.25

#14. Production of different types of cars (in thousands) in a company for years 1992 to 1996 is given in table. What was the percentage of production of type -A car in 1995 to its total production over the years ?
Product of A in 1995=190
total production of A= 950
(190/950)x100=20%

#15. Study the given table and answer the question that follows.
The table shows the number of candidates who appeared (APP). qualified (QUAL) and selected (sel) in a competitive examination from four state Delhi. Goa, Karnataka, and Maharashtra over the years 2012 to 2016. The number of candidates selected from Maharashtra during the period under review is approximately what percentage of the number selected from Delhi during this period ?
Selected from Maharashtra =364
Selected from Delhi = 384
(364/384)x100=94.79%

#16. The table shows the score of three attempts of Archery players in a tournament. The player scoring the highest average score was declared the best player. Who was the best player ?
Average of player =total Score/Attempt
Angela Average=192/3
Preeti Aveage=227.80
In this table we can see that score of Preeti are more and She is best player.

#17. The above table gives the information of the number of students (in thousands) placed in five different companies during six different years.What is the difference ( in thousands) between the students placed in all companies in the year 2014 and 2012 ?
Student placed in 2014=65.7
Student placed in 2012=57.5
Difference =8.2 thousand = 8200

#18. The table given shows the sales of two companies in 5 years. L1 = The difference between the total sales of A and B in all years.
L2 = The value of average sales of A in all years .
What is the value of (L1 : L2) ?
Sales of A =2750
Sale of B= 3550
L1=3550-2750=800
L2=Average Sales of A=2750/5=550
L1:L2=800:550=80:55=16:11

#19. The table given shows the population of two states A and B in 5 years. What is the ratio of total population of B in year R, S and T to the total population of A in year P, Q and R ?
Population of B in years R,S,T=550
Population of A in year P,Q,R=1000
Ratio =550:1000 =55:100=11:20

#20. The heights of 48 students of a class are show in the table. What is the percentage of student whose height is more than 160 cm ?
More than 160 =48-18=30
Total =48
(30/48)x100=62.5%